XAUUSD H1: The Ichimoku Forecast for the Asian Session on 6.2.2025
06.02.2025 01:01
Teknikal
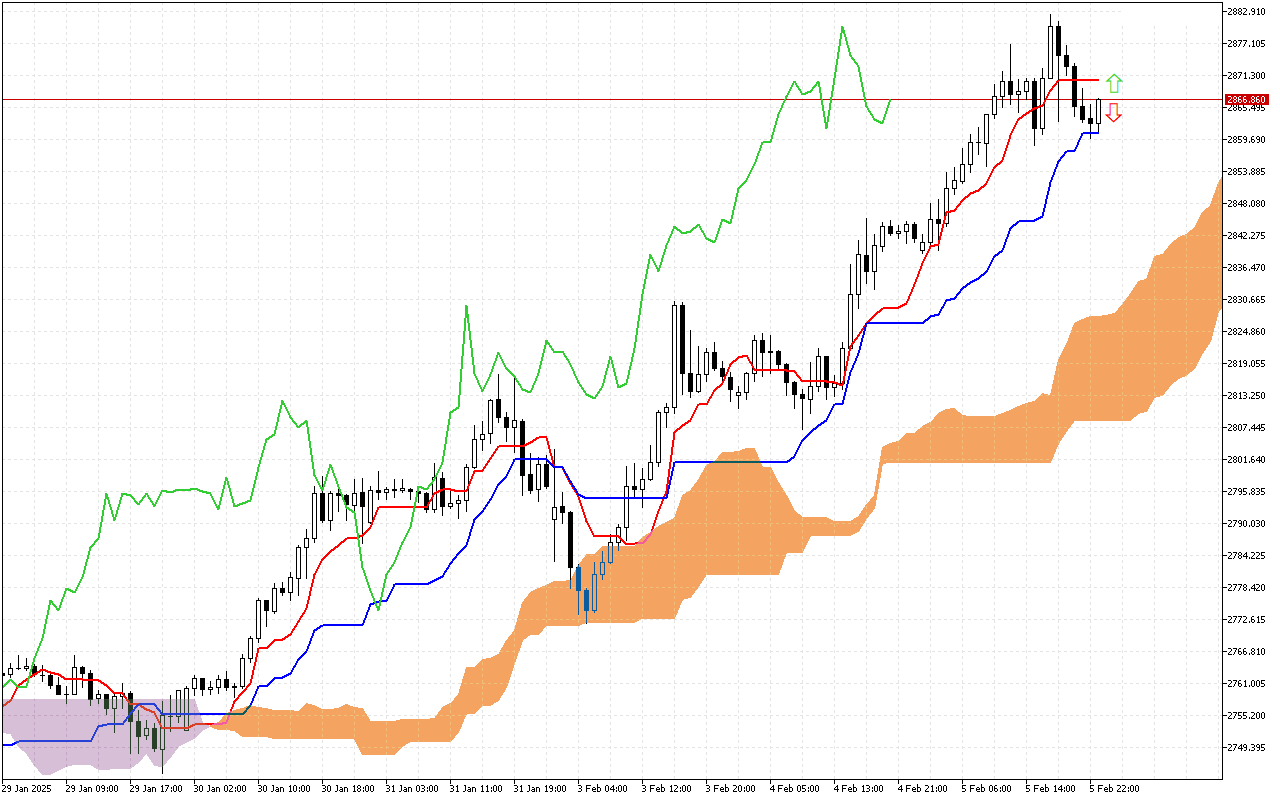
One of the most important signals in the Ichimoku indicator is the intersection of the Tenkan and Kijun lines. On the current XAUUSD chart, this signal is marked with a pink square. Subsequent developments led to a decrease in the price for the Tenkan line. The upward momentum, that was initially suggested as an intersection, did not materialize. Instead, the price showed weakness and was unable to maintain its positions.
The current situation
Let's carefully look at the current values of the main components of the Ichimoku indicator to assess the current state of the market:
The price is currently above the Tenkan and the Kijun lines. It indicates a temporary slowdown in movement and a potential price consolidation.
The dynamics of price movement over a longer distance is determined by the Kumo cloud, which is now colored orange. Thus, this signal prioritizes the upward vector of price movement in the future.
Currently, the Kumo cloud lines represent a dynamic support area for price.
The Chikou line, which displays the closing price with a lag of 26 periods, is above the current price.
Trading recommendations:
Dynamic support levels are located on the Kijun line, near the 2860.650, the SenkouA line, at the 2827.576, and the SenkouB line, near the 2808.675.
The dynamic resistance level is on the Tenkan line, around the 2870.410 mark.
Based on the results of the analysis, most technical indicators of the Ichimoku system indicate an upcoming price increase. Therefore, intraday it is worth prioritize the long positions that can be considered from the defined support levels.