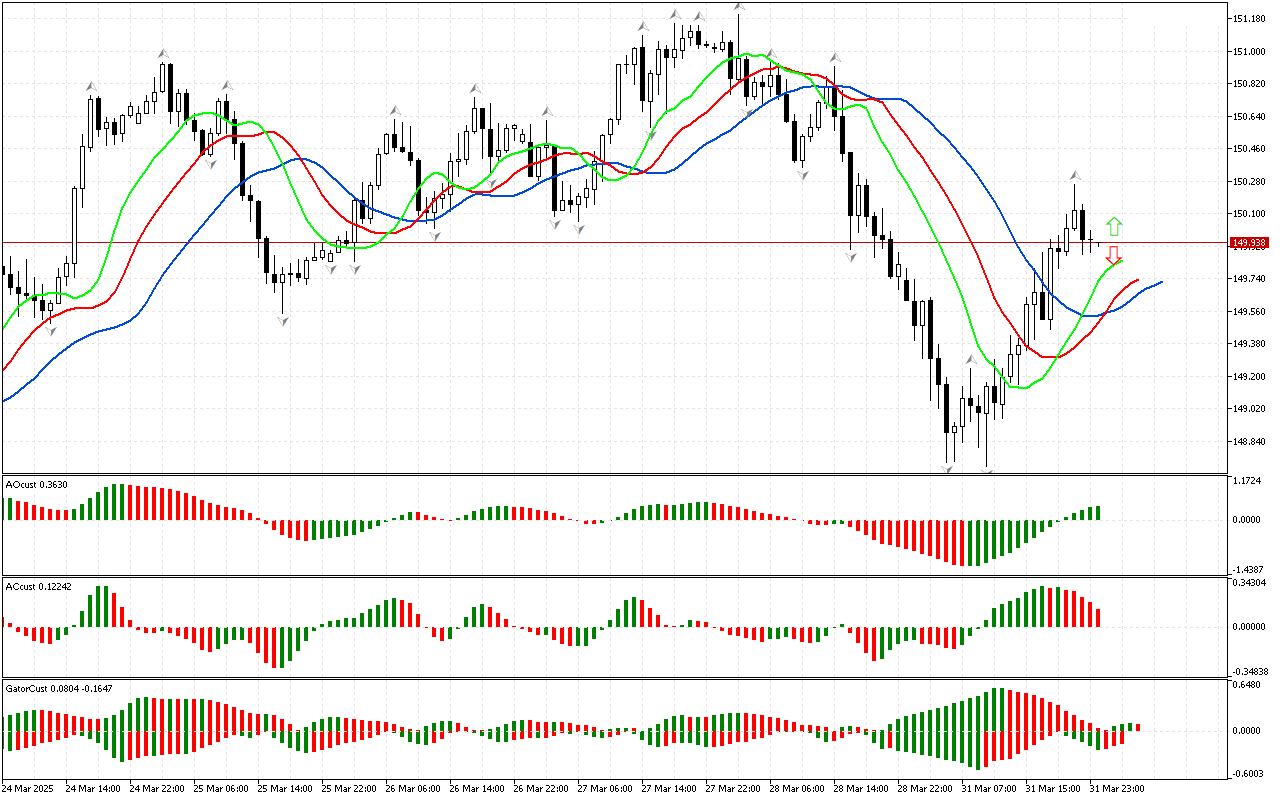
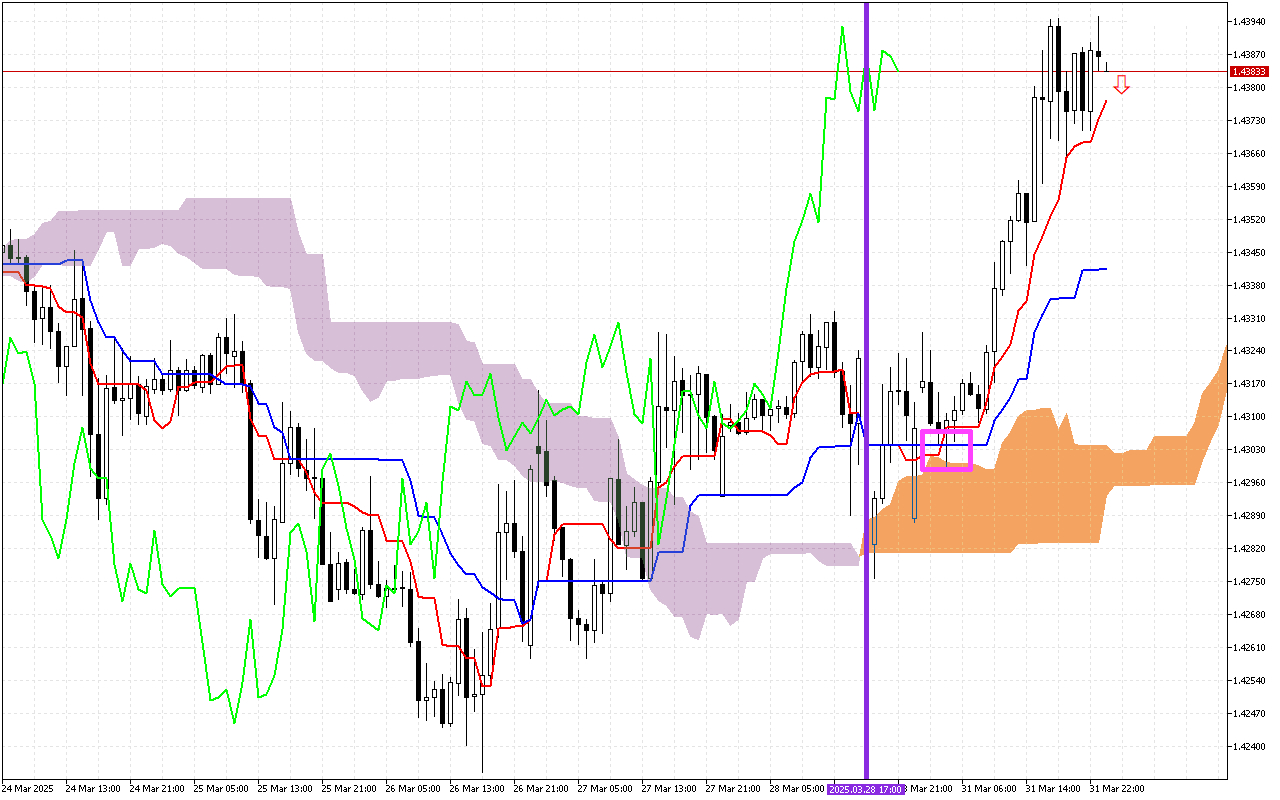
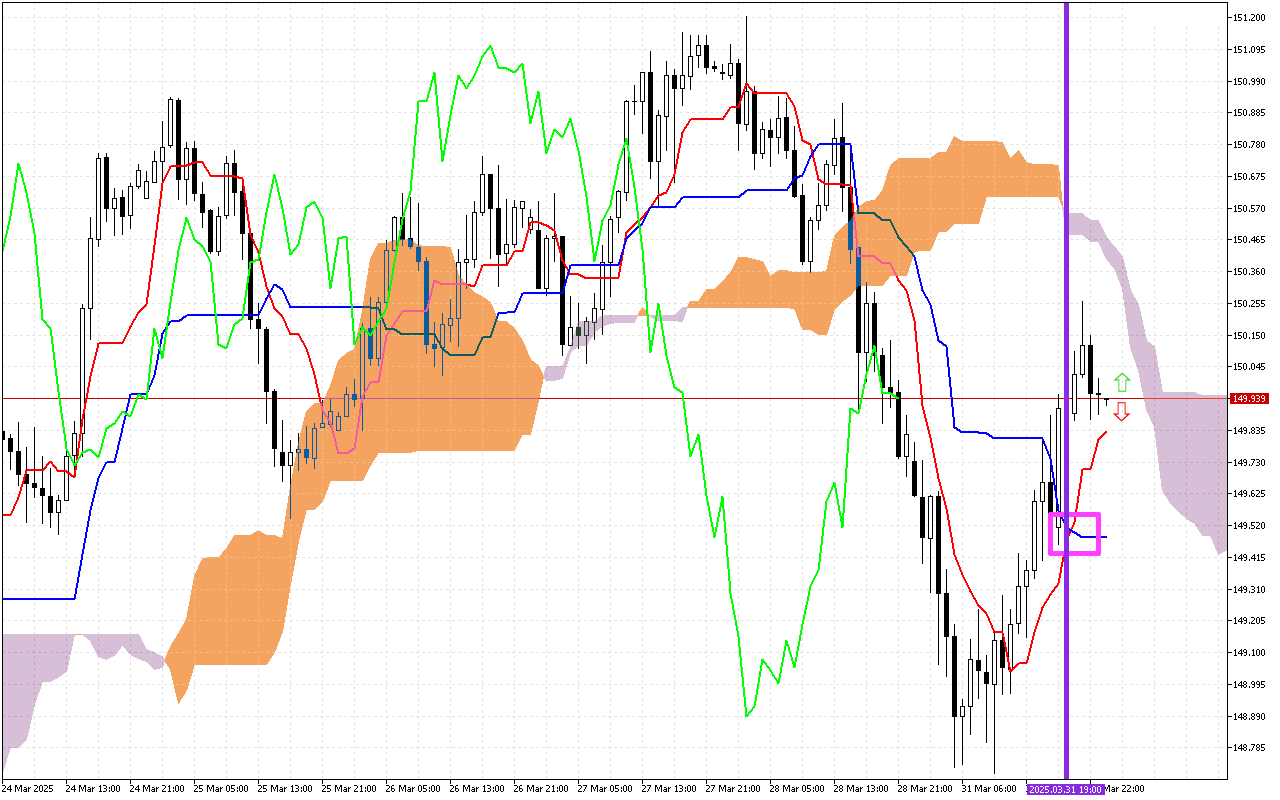
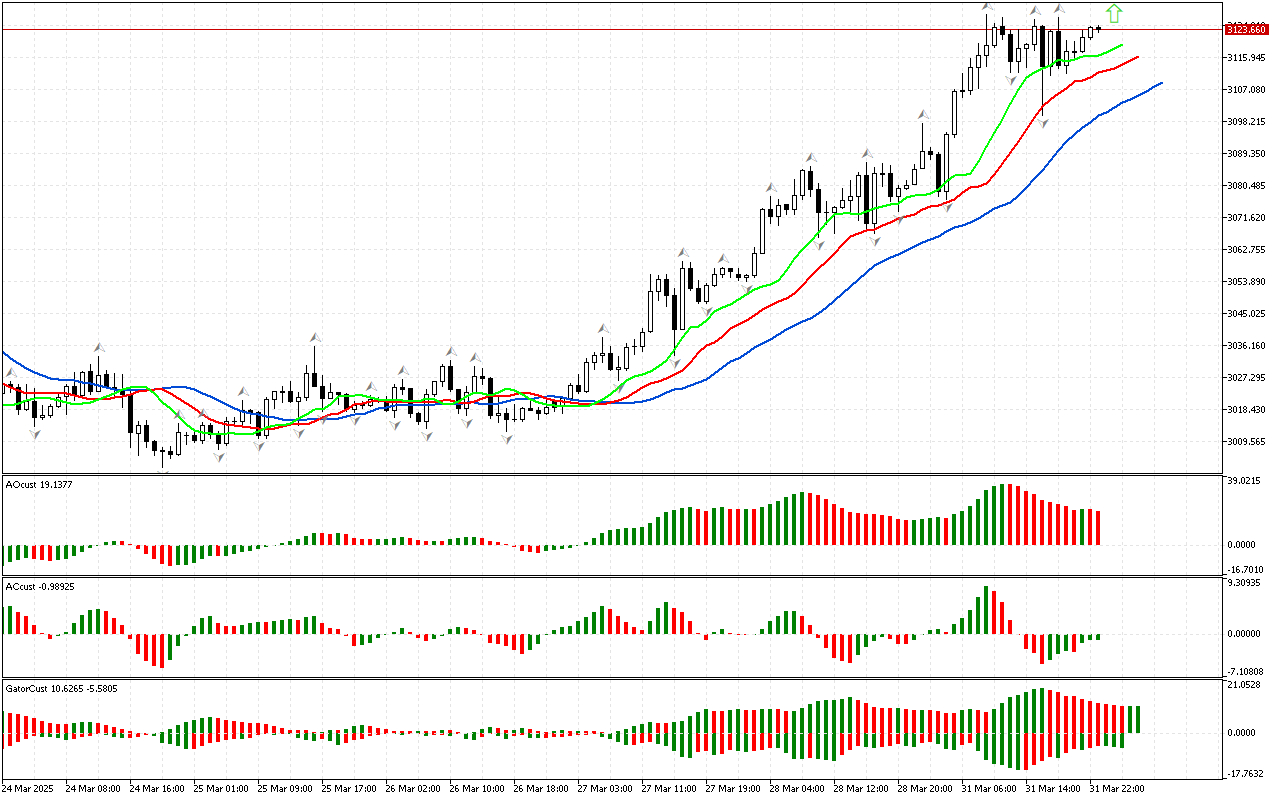
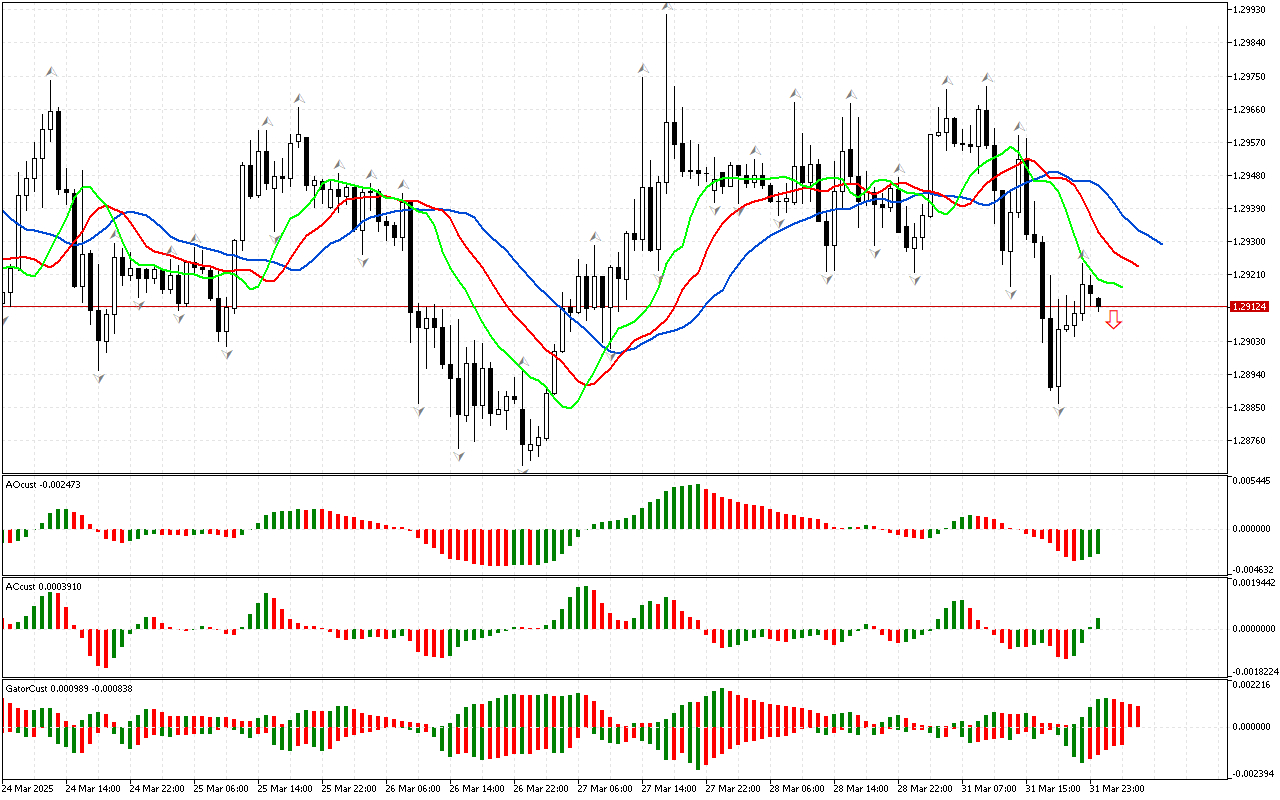
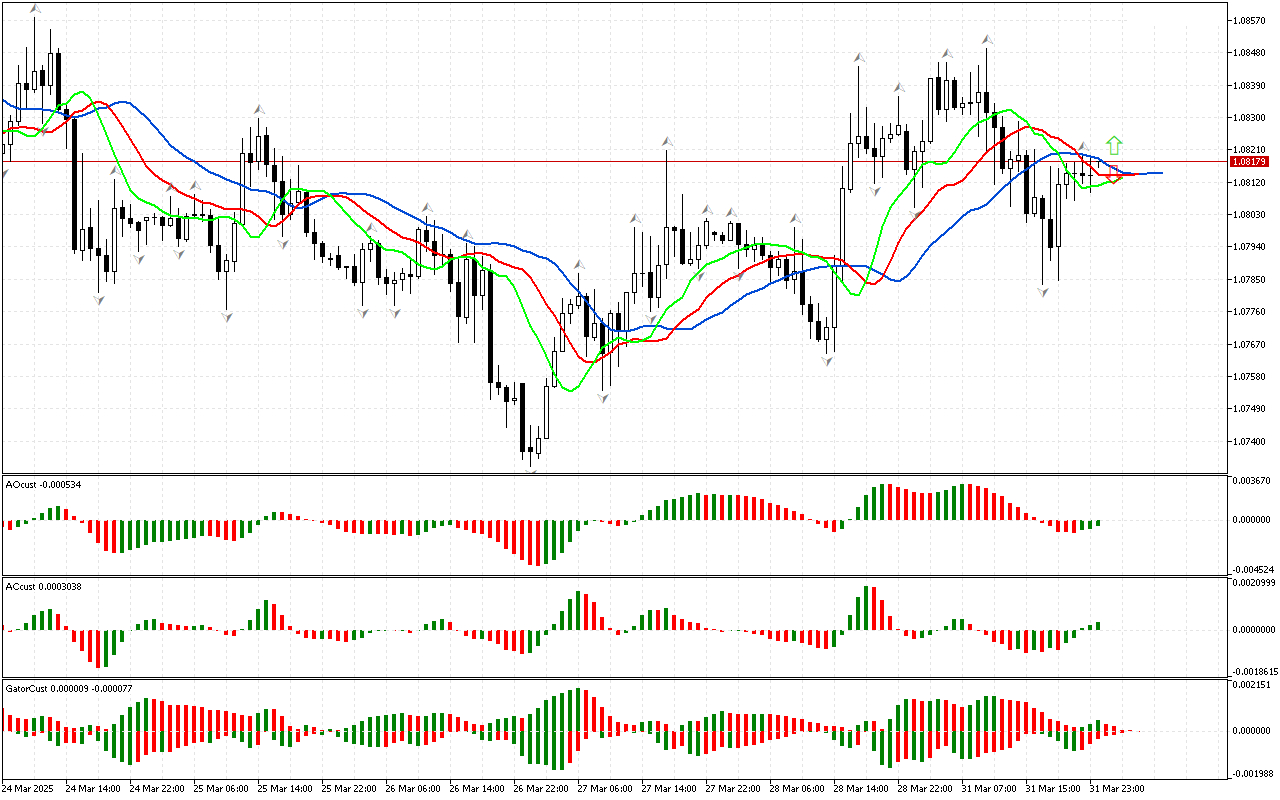
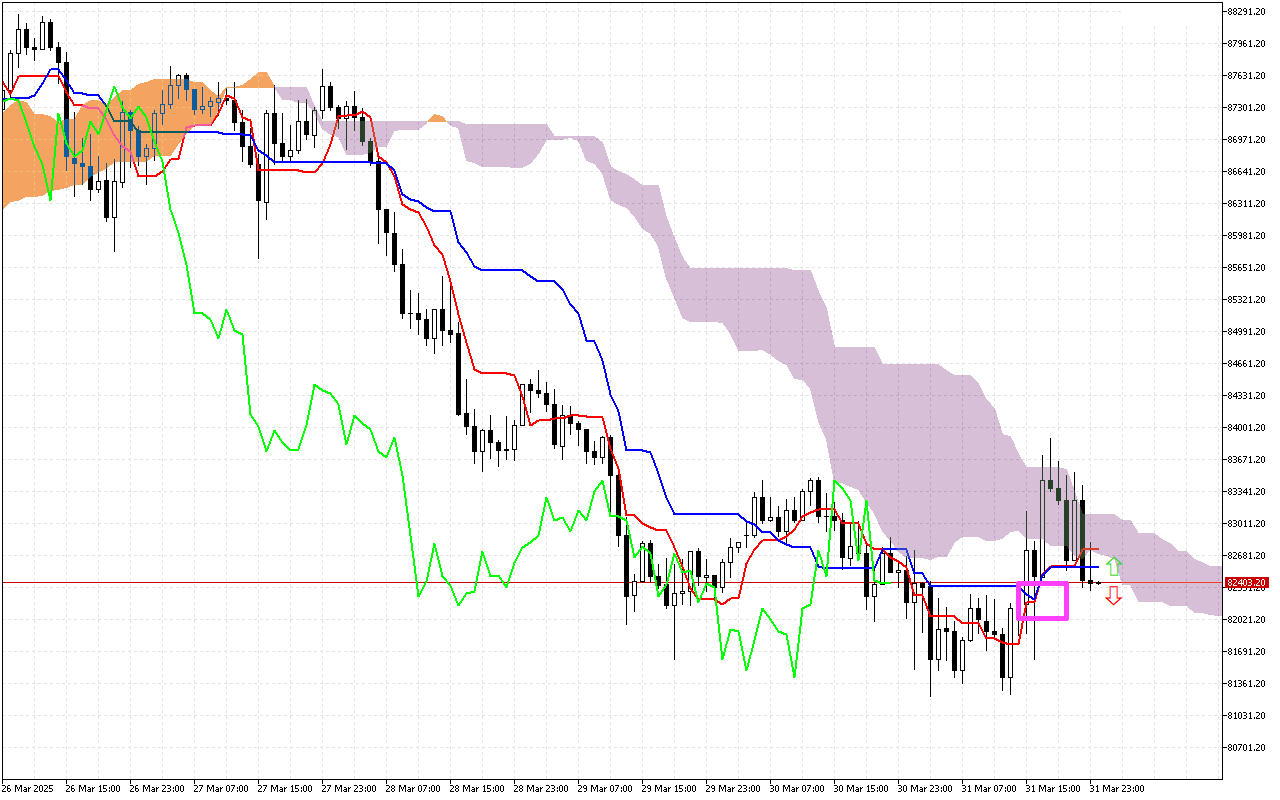
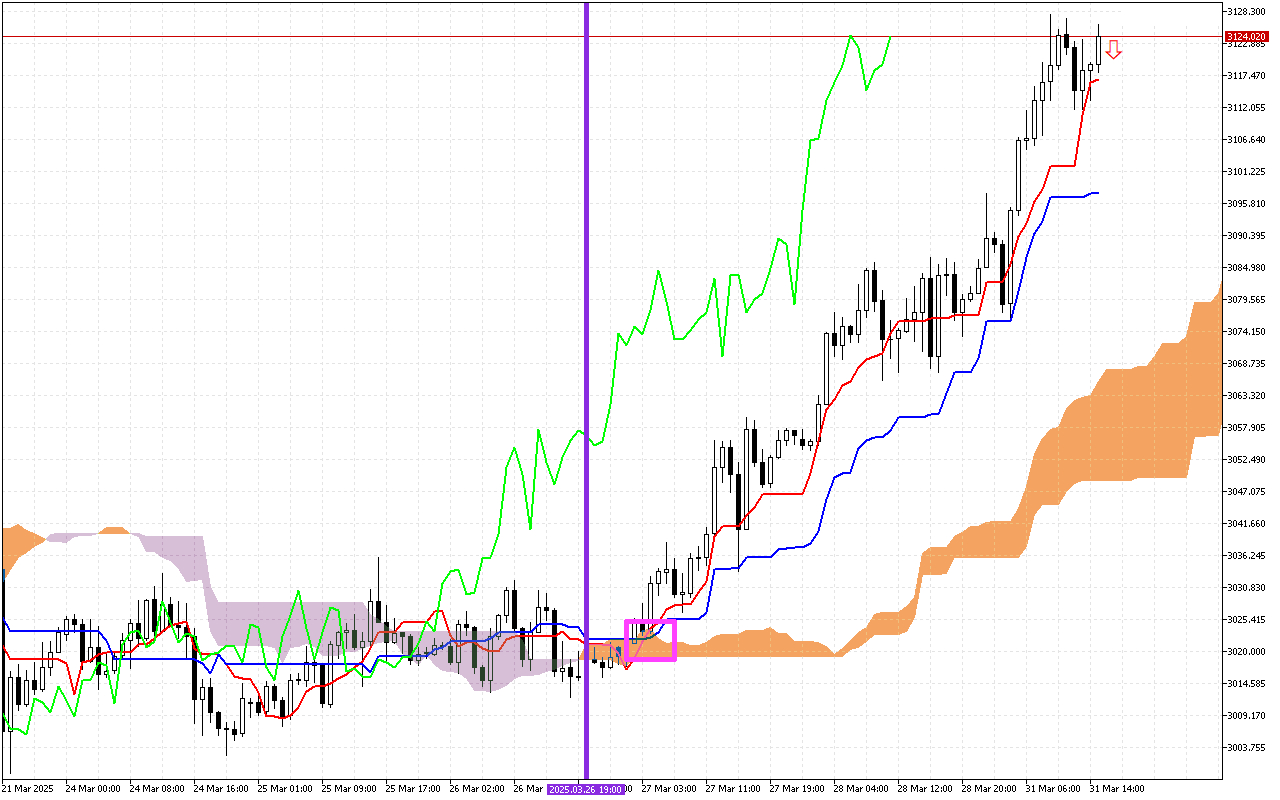
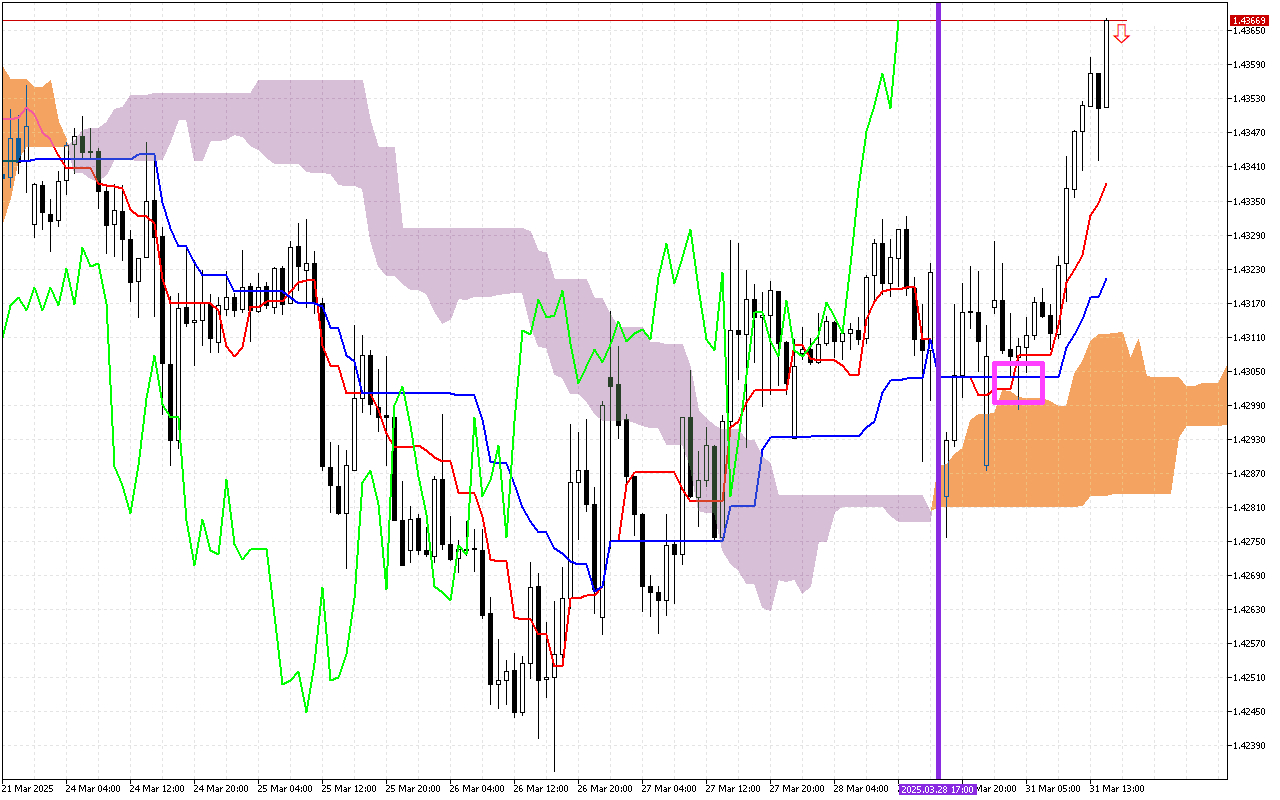
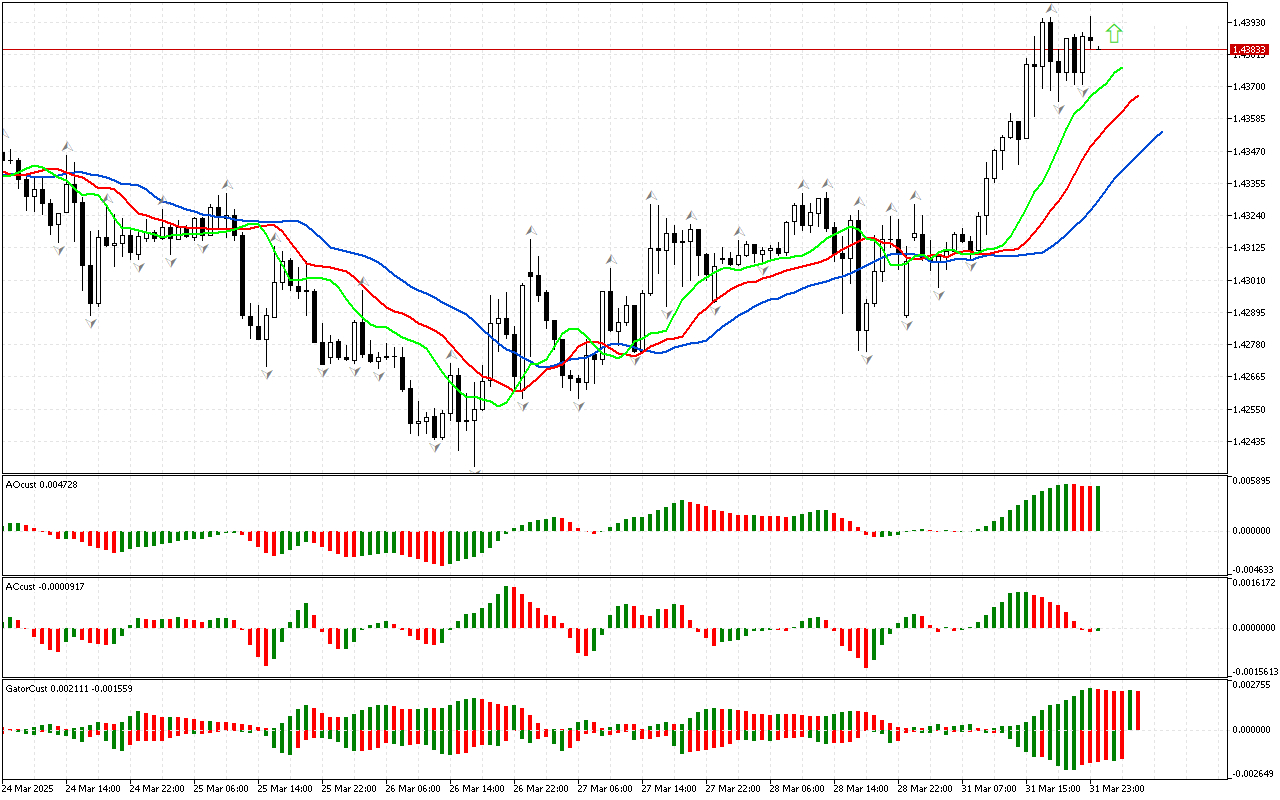
![Brent H1: The Ichimoku Forecast for the American Session on 5.2.2025](/uploads/analytics/666/497/33222206.jpg)
Brent H1: The Ichimoku Forecast for the American Session on 5.2.2025
One of the most important signals in the Ichimoku indicator is the intersection of the Tenkan and Kijun lines. On the current Brent chart, this signal is marked with a...
The key moment of previous trading sessions was the intersection of the Tenkan and Kijun lines. This signal is marked on the chart with a pink square and indicates a...
One of the main signals of previous trading sessions was the intersection of the Tenkan and Kijun lines. This area is marked with a pink square on the graph. The...
During previous trading sessions, the intersection of the Tenkan and Kijun lines, marked with a pink square, was observed on the USDCAD chart. This signal indicates a potential change in...
The main signal of the latest trading sessions is the intersection of the Tenkan and Kijun lines, marked on the chart with a pink square. This is a negative signal....
One of the main signals of previous trading sessions was the intersection of the Tenkan and Kijun lines. This area is marked with a pink square on the graph. The...
The review of the Brent chart traditionally begins with the analysis of the first dimension of the market. The price has fallen below the lower fractal. It means the phase...
There remains uncertainty regarding Bitcoin. The price neither fell below, nor rose above any fractal. In this situation, it is worth refraining from active actions in the market and waiting...
The price has risen above the upper fractal located above the Alligator's mouth on the chart. Due to this signal, we define the phase space as a northern one and...
The review of the USDCAD chart traditionally begins with the analysis of the first dimension of the market. The price has fallen below the lower fractal. It means the phase...
The review begins with the analysis of the first dimension of the market. The price has fallen below the lower fractal, located outside the Alligator's mouth. Therefore, the phase space...
The price has risen above the upper fractal located above the Alligator's mouth on the chart. Due to this signal, we define the phase space as a northern one and...
An analysis of the first phase of the market begins the review. The price is noted to have risen above the upper fractal on the chart. It determines the direction...
One of the main signals of previous trading sessions was the intersection of the Tenkan and Kijun lines. This area is marked with a pink square on the graph. The...